|
|
|
|
|
|
|
|
||||||
|
|
|
|
|
|
|
|
||||||
|
|
|
|
SciCa 3.0Home... Overview Computation / Analysis SciCa 3.0 computes the result of any valid and correct mathematical expression that is entered into the input field. The formula can be entered using the provided number pad or with the keypoard. After pressing the "Enter" button the expression as well as the result are shown in the output window. If the entered formula contains a syntax error or a mathematical error (e.g. division by zero), an error message will appear, identifying the type and location of the error in the expression. 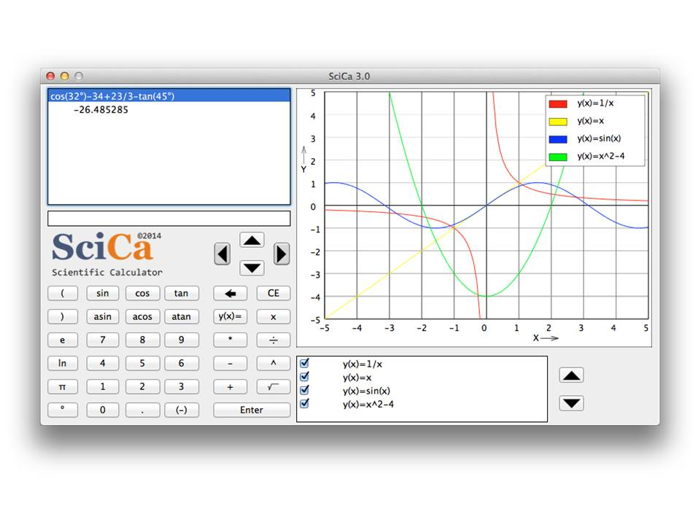 The Application can also be used to display and and analyze two dimensional functions The function can be entered via the keyboard or using the provided buttons from the number-pad that already contain the correct variable definitions "y(x)=" and "x". Please note that only the variable names "x" (for independent variable) and "y" (for dependent variable) can be used...other variable names will lead to a syntax error. 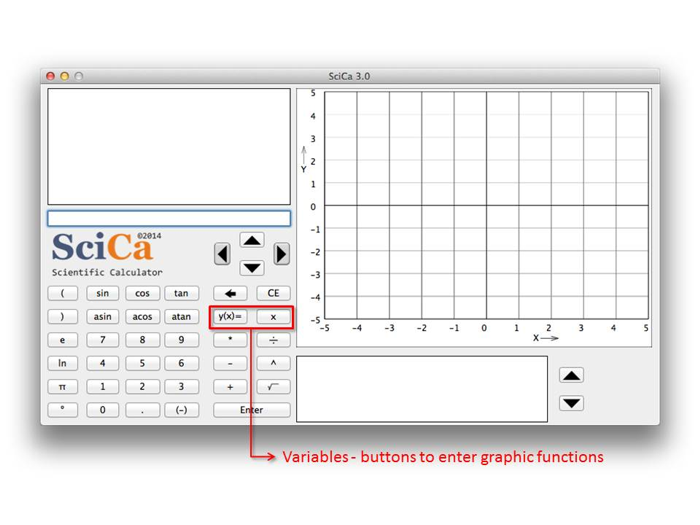 A maximum of five functions can be stored by the application at the same time. The functions are shown in the list box. Selecting and de-selecting the check box shows or hides the corresponding function, respectively. You can change the order of the functions in the list using the "Up" and "Down" buttons. To remove a function from the list, select it in the list box and press the "Clear" button. 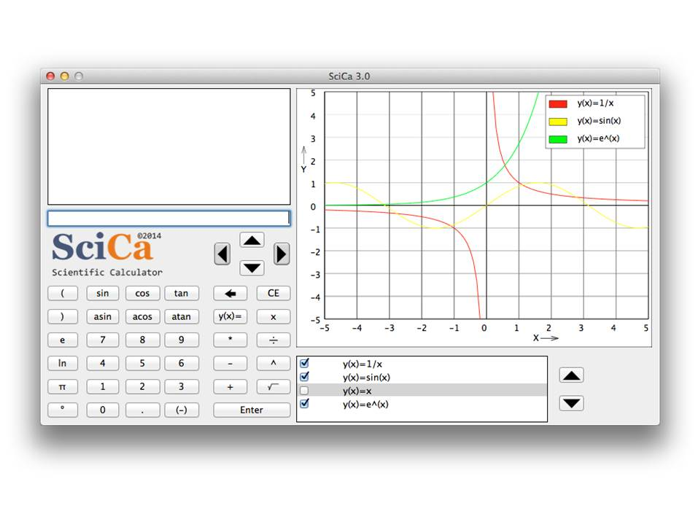 The graphic properties and the the range for x and y axis of the chart can be adjusted with "SciCa" - "Preferences". The "Reset" button will restore all values to the original default. 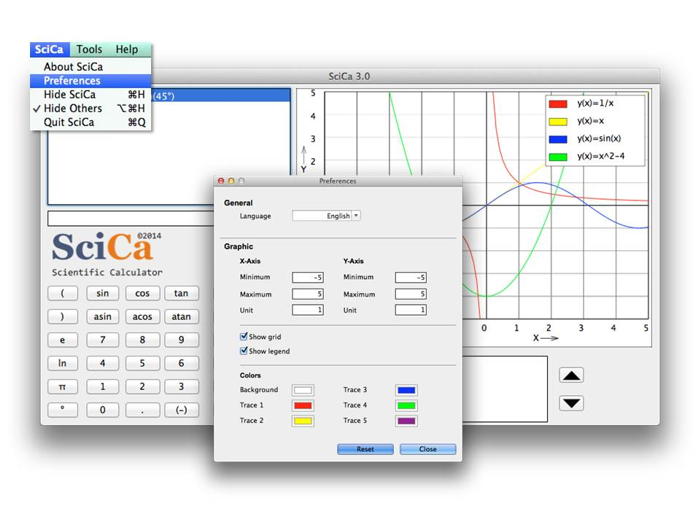 SciCa 3.0 offers a tool to analyze the characteristic points of the displayed functions. To use it, select "Graphic Tools" from the "Tools" menu. Here you can select which points you would like to determine ("Roots" or "Extremas") for which function. Click "Close" and the results will be displayed in the graphic window. 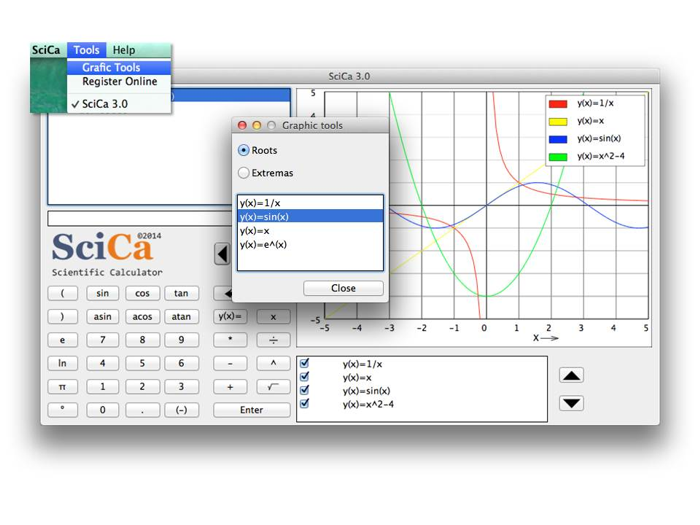 Please note that these characteristic points are computed numerically, which means that the results will never be exact. In the example below you can see clearly that there is a small difference of the displayed roots to the exact results. The exact results for the roots of the function y(x)=sin(x) are x = -PI, x = 0, x = PI. The precision with which SciCa computes the characteristic points is 1/5000 of the x range displayed in the graphic window. Therefore, in order to increase the precision, simply select a smaller x range around the characteristic point, using "SciCa" - "Preferences". 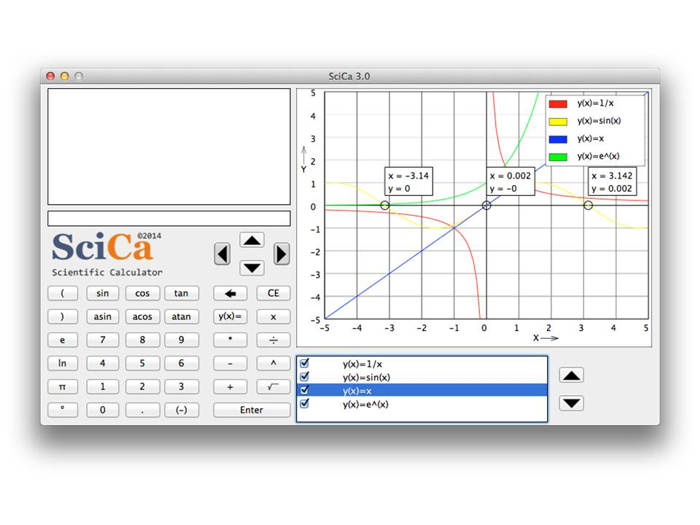 |
|
|
|
||||||
|
|
|
|
|
|
|
|
||||||

